

Industrial equipment capacity planning is the practice of aligning production resources with demand to ensure efficient equipment utilization and meet operational goals. Most operations managers treat it as a scheduling task. It is actually a measurement discipline first. You cannot plan what you have not accurately measured. This guide covers how to calculate true available capacity, which expansion strategies fit which conditions, what tools handle real operational complexity, and how planning decisions connect directly to capital investment outcomes.
What is industrial equipment capacity planning and why does it matter?
Capacity planning matches your equipment’s real output capability to your production demand forecast. The critical word is “real.” Nameplate capacity, the rated output printed on a machine’s specification sheet, rarely reflects what that machine actually delivers in production conditions. Plants relying on nameplate ratings overestimate true capacity by 30% to 50%. That gap causes missed delivery commitments, overloaded schedules, and misallocated capital.
The industry standard metric for closing that gap is Overall Equipment Effectiveness, or OEE. OEE multiplies availability, performance, and quality rates into a single utilization figure. A machine running at 85% OEE is delivering 85% of its theoretical output. Planning against 100% of nameplate capacity while actual OEE sits at 70% creates a 30-point planning error before a single work order is released.
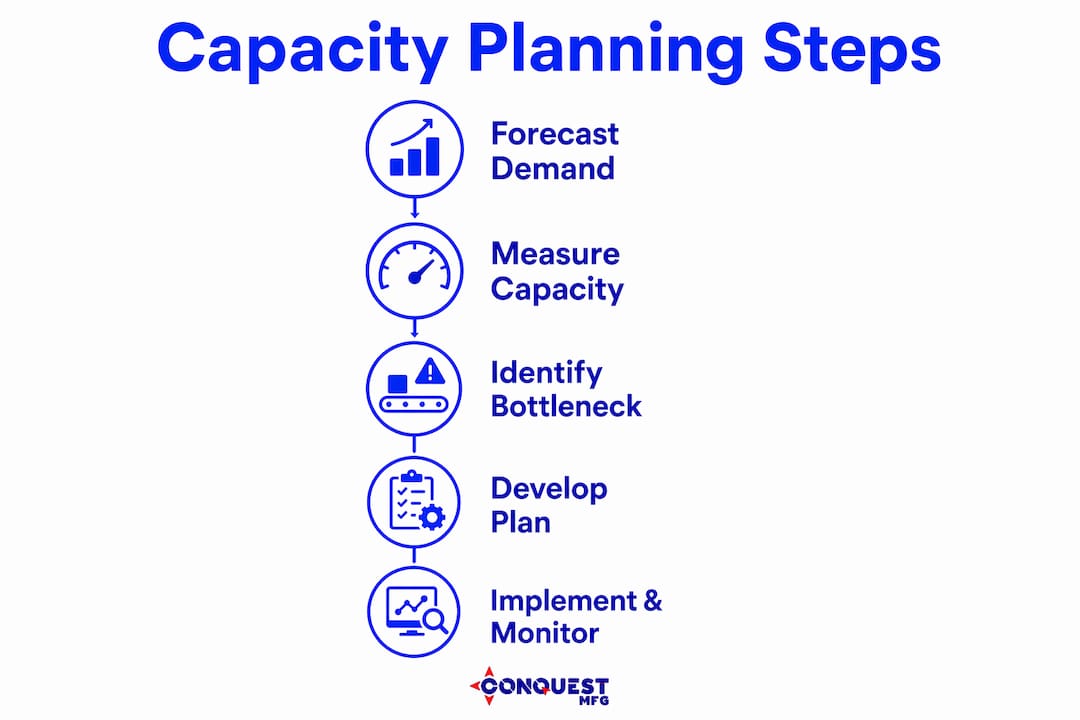
Bottleneck identification is the second foundational concept. Every production system has one resource that limits total throughput. That resource is the constraint. All other resources are non-constraints. Capacity planning that ignores this distinction wastes investment on the wrong machines.
How to accurately measure true equipment capacity
Three capacity definitions matter in industrial settings, and confusing them is the most common planning error.
| Capacity Type | Definition | Planning Use |
|---|---|---|
| Nameplate capacity | Manufacturer’s rated maximum output | Never use for scheduling |
| Theoretical capacity | Max output assuming zero downtime | Baseline reference only |
| Effective capacity | Actual output accounting for OEE, maintenance, and changeover | Use for all scheduling and planning |
Effective capacity is the only number that belongs in a production schedule. Using theoretical or practical capacity for planning causes overloaded schedules and missed deliveries. The calculation requires empirical data, not standard rates from an ERP system.
The correct inputs for effective capacity are: actual run hours per shift, measured cycle times from PLC or production logs, scheduled and unscheduled downtime records, and changeover durations by product type. Feed those numbers into your OEE calculation and you get a defensible capacity figure. A 2026 case study demonstrated this clearly. An assembly operation carried a utilization rate of 256% when measured against nameplate capacity. After calculating effective capacity and combining regular hours, overtime, and subcontracting, the team reduced utilization to a sustainable 95%.
Pro Tip: Never pull planned hours from your ERP as a proxy for actual capacity. ERP standard rates are set at implementation and rarely updated. Pull live PLC data or timed observations instead.
What are the main strategies for equipment capacity expansion?
Three strategies govern when and how to add capacity. Each fits a different business condition.
- Lead strategy. Add capacity before demand arrives. This approach captures growth opportunities and prevents lost sales. The trade-off is capital deployed ahead of confirmed revenue. It suits high-growth markets or long equipment lead times where waiting is not an option.
- Lag strategy. Add capacity only after utilization exceeds 90–95% on bottleneck resources. This preserves capital and avoids excess capacity costs. The risk is a gap between demand arrival and capacity availability.
- Match strategy. Add capacity in smaller increments, closely tracking demand growth. This reduces both the risk of over-investment and the risk of shortfall. It requires accurate demand forecasting and equipment options that scale incrementally.
Beyond timing, the Theory of Constraints shapes where to invest. Effective capacity planning protects constraint capacity over maximizing all equipment utilization. A non-constraint machine running at 100% utilization does not increase throughput. It builds work-in-process inventory in front of the bottleneck and creates the illusion of productivity.
The practical rule: subordinate every non-constraint resource to the bottleneck’s pace. If the bottleneck processes 40 units per hour, non-constraints should feed at that rate, not their maximum rate. Higher utilization does not always equate to better productivity. This is the counterintuitive truth that separates effective planners from busy ones.
Pro Tip: Before approving a capital request for new equipment, ask whether a workflow improvement at the bottleneck could deliver the same output increase. Process improvements yielding a 20% cycle time reduction can increase facility capacity by 25% without new equipment costs.
What tools and methodologies support effective capacity planning?
The right tool depends on your operation’s complexity. A clear threshold separates manual from software-based planning.
When manual planning works
Spreadsheets and manual tracking handle simple environments. The limit is 8–10 machines or 30+ active work orders. Beyond that threshold, shared routing complexity creates cascading errors that manual tools cannot catch. A delay on one machine ripples across multiple work orders, and a spreadsheet cannot recalculate those dependencies in real time.
Core planning methodologies
-
Rough-cut capacity planning (RCCP). A high-level check that validates whether a master production schedule is feasible before detailed scheduling begins. RCCP compares aggregate load against aggregate capacity at key work centers. It catches gross overloads early, before they become shop floor problems.
-
Finite capacity scheduling (FCS). Finite capacity scheduling identifies overloaded machines and sequences jobs within actual capacity limits to produce realistic completion dates. Unlike infinite scheduling, FCS refuses to assign more work to a resource than it can complete. The output is a schedule that reflects reality, not optimism.
-
Visual load management. Gantt charts show job sequences and timing. Load histograms display capacity utilization by resource over time. Both tools make overloads visible before they occur. A histogram showing a work center at 140% load next week is a decision prompt, not a surprise.
What capacity planning software adds
Software platforms that integrate with ERP systems and live production data add scenario analysis capability. You can model the impact of adding a shift, subcontracting a work center, or improving OEE by five points, all before committing resources. That scenario modeling is where software earns its cost. You can also optimize construction equipment usage more effectively when your planning tool reflects actual production conditions rather than static standard rates.
Pro Tip: Run at least three scenarios before any capacity decision: current state, process improvement only, and capital addition. The comparison often shows that process improvement delivers 70–80% of the benefit at a fraction of the cost.
How does capacity planning affect operational efficiency and capital investment?
Accurate capacity planning changes the quality of capital decisions. The financial stakes are significant in both directions.
| Planning error | Operational consequence | Financial consequence |
|---|---|---|
| Overestimating capacity | Overloaded schedules, missed deliveries | Lost contracts, expediting costs |
| Underestimating capacity | Idle equipment, excess labor | Unnecessary capital expenditure |
| Ignoring bottleneck | WIP buildup, throughput ceiling | Investment in wrong resources |
| Relying on nameplate ratings | 30–50% capacity gap in planning | Chronic schedule failures |
The 30–50% overestimation error from nameplate reliance is not a minor rounding issue. It means a facility that believes it has 1,000 hours of monthly capacity may actually have 600–700 hours. Every schedule built on the higher number is structurally impossible to execute.
The investment threshold for bottleneck resources is utilization at or above 90–95%. Below that level, process improvements and scheduling adjustments typically deliver better returns than capital additions. Above that level, the bottleneck is genuinely constraining throughput and investment is justified.
The ROI case for process improvement is strong. A 20% reduction in cycle time at the bottleneck translates directly to a 25% capacity increase across the entire system. That gain requires no new equipment, no additional floor space, and no extended lead time for delivery. For operations managers evaluating batch plant selection or other capital-intensive equipment decisions, this comparison belongs in every business case.
Excess work-in-process inventory is the visible symptom of poor capacity balance. When non-constraints run faster than the bottleneck, material piles up. That inventory ties up working capital, obscures quality problems, and extends lead times. Balancing utilization across the system, rather than maximizing each machine independently, eliminates that buildup.
Key Takeaways
Effective industrial equipment capacity planning requires measuring true effective capacity, protecting bottleneck resources, and choosing expansion strategies based on real utilization data rather than nameplate ratings.
| Point | Details |
|---|---|
| Use effective capacity, not nameplate ratings | Nameplate reliance overestimates true capacity by 30–50%, causing chronic schedule failures. |
| Protect the bottleneck first | Utilization above 90–95% on constraint resources signals the need for investment, not on non-constraints. |
| Process improvements before capital | A 20% cycle time reduction can deliver a 25% capacity increase without new equipment costs. |
| Software is required beyond 8–10 machines | Manual planning cannot handle shared routing complexity at scale; finite capacity scheduling tools are necessary. |
| Match strategy to business conditions | Lead, lag, and match strategies each fit different demand growth rates and capital risk profiles. |
What most planners get wrong about capacity
The most persistent mistake I see is treating capacity planning as a one-time exercise tied to the annual budget cycle. Operations change continuously. A machine that ran at 78% OEE in january may be at 61% by march due to aging tooling or increased changeover frequency. A plan built on january’s numbers is wrong by spring, and nobody has updated it.
The second mistake is the instinct to maximize every machine’s utilization. It feels productive. The numbers look good in a weekly report. But a non-constraint running at 100% while the bottleneck sits at 85% is not a win. It is a WIP accumulation problem waiting to surface as a delivery failure.
The third mistake is underestimating how quickly manual planning breaks down. I have watched experienced planners manage 12 machines across 40 active work orders using spreadsheets. They spend more time updating the spreadsheet than analyzing the output. At that complexity level, the spreadsheet is the bottleneck, and the planner’s judgment is being wasted on data entry.
The practical fix for all three: measure actual output weekly using live data, set a firm rule that non-constraints pace to the bottleneck, and evaluate planning software the moment your active work order count consistently exceeds 30. The software investment pays back in schedule reliability within the first quarter of use.
— Sam
Conquest Mfg builds equipment that performs at planned capacity
Operations managers need equipment that delivers on its specifications, not equipment that requires constant adjustment between nameplate ratings and real-world output. Conquest Mfg designs and manufactures industrial equipment built to perform consistently at the capacity your operation depends on.

From concrete batch plants and semi trailers to dry bulk pneumatic trailers and vacuum tanks, Conquest Mfg builds to the specifications that your production plan requires. Every piece of equipment is tailored to your operational conditions, not generic industry averages. Contact Conquest Mfg to discuss equipment specifications that align with your capacity targets.
FAQ
What is the difference between nameplate and effective capacity?
Nameplate capacity is the manufacturer’s rated maximum output under ideal conditions. Effective capacity accounts for OEE, maintenance, and changeover times, and is typically 30–50% lower than nameplate ratings.
When should a facility invest in new equipment versus process improvements?
New equipment investment is justified when bottleneck utilization consistently exceeds 90–95%. Below that threshold, process improvements typically deliver better returns, with a 20% cycle time reduction capable of increasing capacity by 25%.
What is finite capacity scheduling?
Finite capacity scheduling sequences jobs within actual machine capacity limits to produce realistic completion dates. It prevents the overloaded schedules that result from infinite scheduling methods that ignore true capacity constraints.
How do I know if my operation needs capacity planning software?
Manual planning breaks down reliably beyond 8–10 machines or 30+ active work orders. At that complexity level, shared routing creates cascading errors that spreadsheets cannot track in real time.
What is a bottleneck resource in capacity planning?
A bottleneck is the single resource that limits total system throughput. Protecting and maximizing output at the bottleneck delivers greater system-wide gains than maximizing utilization across all machines simultaneously.